Mixing… It can make or break a great song.
Whether you are a producer, an artist, or a songwriter, a great mix can make the difference between a song that gets picked up and one that doesn’t.
Unfortunately, mixing can be an area where many songwriters and producers stumble in their creative process. It is very easy to go overboard with EQ cuts and boosts if you lack the knowledge of where each element falls in the frequency spectrum.
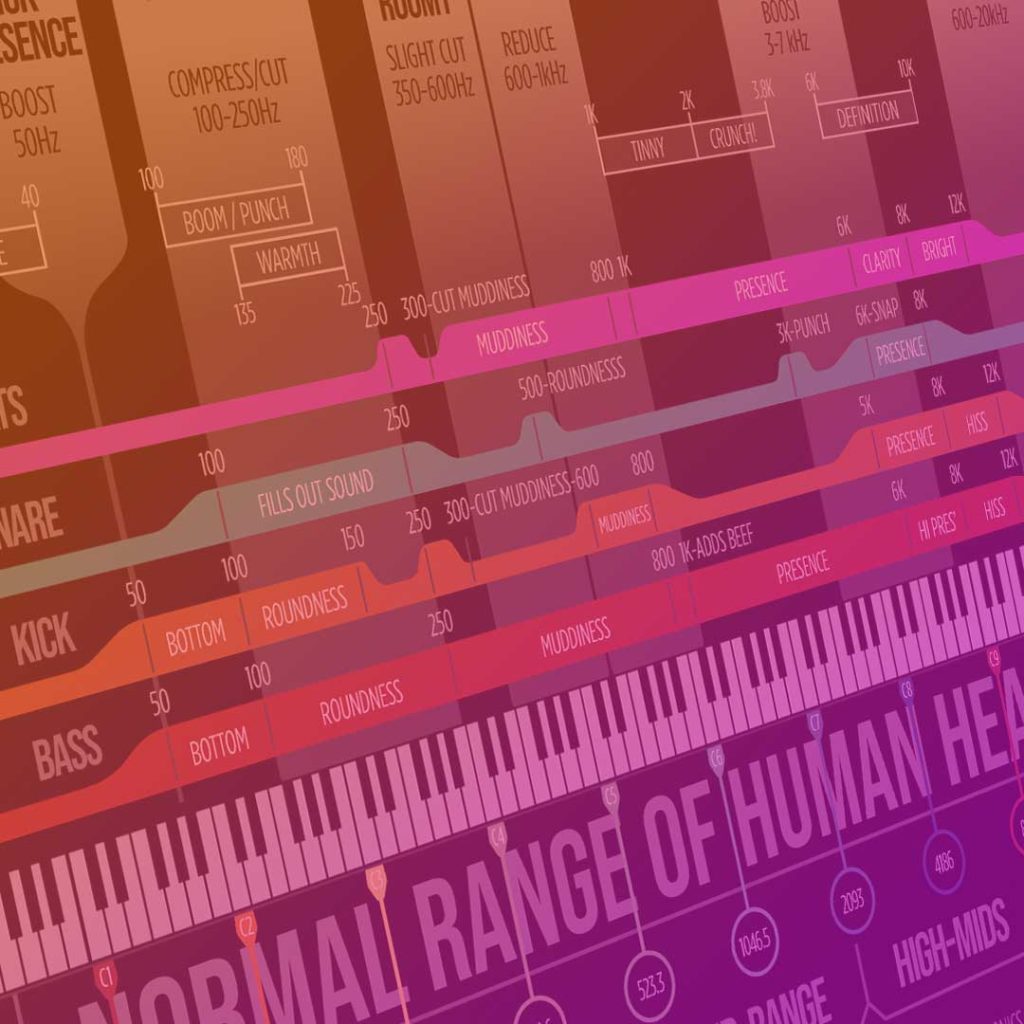
Luckily, this fantastic infographic, inspired by one originally shared via the email newsletter of The Glitch Mob, can help you fine-tune your track into a radio-ready smash. There’s a lot of information included here, so pay close attention! 🙂
Download the Complete 4K Resolution Infographic Here
I don’t know about you guys, but I absolutely love infographics – especially when they help me make better music. Let’s dig into this one and see what insights we can gather.
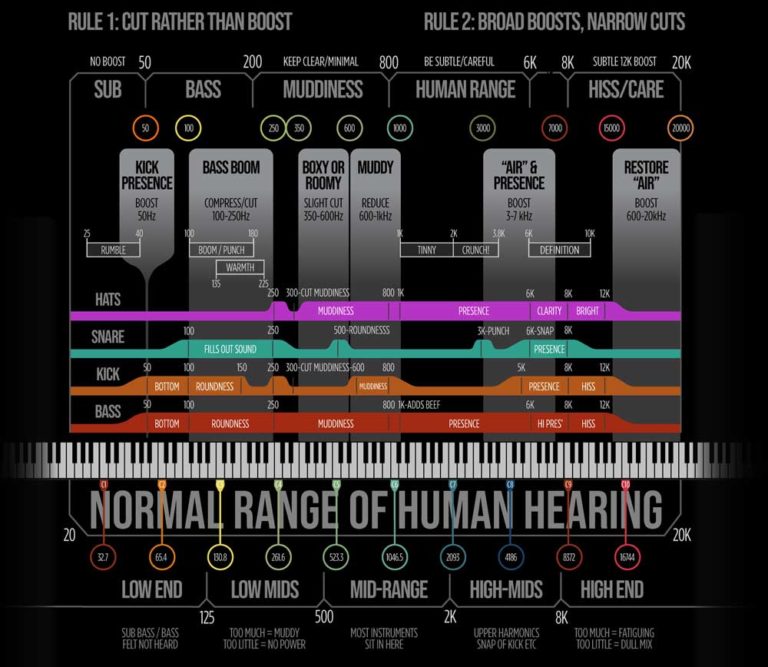
Rule 1: Cut Rather Than Boost
Firstly, it must be said that any rule that applies to mixing should always be overridden by whether “it sounds good” or not. In audio, and certainly in all creative endeavors, rules exist as a framework for you and me to bend and break to our will. That said, it is generally a better idea to make frequency cuts (ie. reducing amplitude) instead of boosts. There are many good reasons that this rule exists, some of which are somewhat technical and outside the scope of this article. Generally speaking though, cutting frequencies will result in a more pleasing sonic representation of the instrument or track that you are working on.
Rule 2: Broad Boosts, Narrow Cuts
When it comes to making the most of a track with EQ, you are most often doing one of two things: 1) Changing or improving the general character of the sound source or 2) Correcting or cleaning up the source audio. This rule is related to the previous one in the way that corrective EQ changes often require more drastic frequency carving than those that are intended to affect the general character of the sound source. It stands to reason that these corrective changes which can be more “targeted”, are best done with cuts. Conversely, more general EQ-ing is a great opportunity to use frequency boosts to fill out the character of the sound.
How Does It Sound?
When describing the sound of a mix or instrument, you’ll often hear people use adjectives that don’t seem like they have much to do with sound: muddy, dark, bright, crunchy, boxy… One of my favorite parts of this chart is that it gives general frequency ranges for some of these adjectives. Of course, it doesn’t account for the possibility that you and I may have a different idea of what “boxy” is – but, hey, it’s a start!
Build It On a Firm Foundation
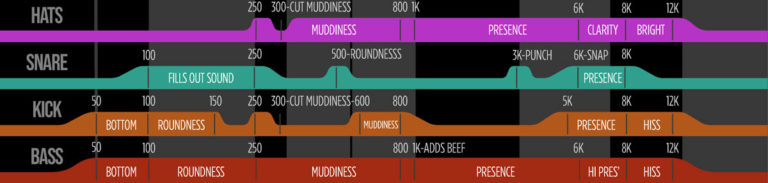
There are some basic instrumental components that you can count on being a foundational part of most music (certainly popular styles of music), and this infographic gives us an excellent insight into where the different parts of each instrument’s character live on the sonic spectrum.
This chart covers the general frequency profiles of the Kick, Snare, Hi-Hats, & Bass. See this clip of the chart:
Can You Hear Me Now?
Another valuable insight contained in this graphic is the range of human hearing, normally from about 20 hz to 20 khz, and where these different sonic textures fall in that range. From low sub bass to shimmery “air”, you can see that there’s a place along the spectrum for each of the instruments mentioned. A great mix will allow all of the various components of the tonal spectrum and their respective instruments to be represented and in balance.
It’s Just The Beginning…
There’s a lot more to uncover from this infographic so make sure you grab the complete 4K Resolution Version. Experiment and use this a reference point when fine-tuning your mixes, and most importantly, don’t forget that these “rules” are meant to be broken. ?
2 Responses to “This Chart Will Help You Improve Your Mixes”
michael
I love infographics!!! Great tip, thanks!
Mike
I agree Michael, I too love infographics.